

This lesson carries even more weight today because the business cycle (the pattern of economic growth and slowdown) is now in its seventh year, while the market cycle is approaching its fifth. For many investors, it can feel as though the same worries keep returning, such as inflation, Federal Reserve policy, and whether stocks are too expensive. Navigating these competing pressures is not just a normal part of investing. It is also the reason that investors who stay the course historically tend to be rewarded over the long run.
There will almost certainly be unexpected events in the second half of the year. These could include new developments in the ongoing Middle East conflict, the upcoming midterm election, and new market activity such as initial public offerings (IPOs), which are when private companies sell shares to the public for the first time. Understanding how to keep perspective as these events unfold is essential for every investor.
Key market and economic highlights from the first half of 20261
- The S&P 500, Nasdaq, and Dow Jones Industrial Average have returned 9.6%, 12.8%, and 8.9% year-to-date through the end of June, respectively. The second quarter was historically strong with the S&P 500 returning 14.9%, the Nasdaq 21.4%, and the Dow 12.9%.
- The Bloomberg U.S. Aggregate Bond Index has risen 0.6% year-to-date. The 10-year Treasury yield ended the second quarter at 4.47%, rising from 4.17% at the start of the year.
- Developed market international stocks (MSCI EAFE) have gained 7.7% and emerging market stocks (MSCI EM) have returned 22.7% year-to-date, both in U.S. dollar terms.
- The Bloomberg Commodities Index has risen 12.3% year-to-date. This was due to a strong first quarter which experienced a gain of 23.3%, versus a decline of 8.9% in the second quarter.
- Brent crude peaked just under $120 per barrel in May before closing the quarter at $73 per barrel.
- Gold prices fell to $4,007 per ounce while Bitcoin declined to a recent low of $58,633.
- Headline CPI rose 4.2% year-over-year in May, driven largely by energy prices. Core CPI, which excludes food and energy, rose 2.9%.
- The Federal Reserve kept rates unchanged at 3.50% to 3.75% through the first half of the year. Kevin Warsh was sworn in as Fed Chair in May.
The business cycle is now in its seventh year of expansion
Some investors may be surprised to learn that the current business cycle began in April 2020, during the height of the pandemic, and recently passed its sixth anniversary in the second quarter of 2026. Over that time, there have been several moments when economists and investors feared a new recession might be coming. These included the period when inflation peaked in 2022 and when tariffs disrupted global trade last year. Through each of these challenges, the economy proved resilient, continuing to grow steadily.
The business cycle touches nearly every part of personal financial life, from mortgage costs to annual pay raises. A healthy economy encourages consumers to spend and businesses to invest, which in turn drives company profits and, ultimately, stock market returns. While the stock market and the broader economy are not exactly the same thing, they are closely connected. The chart above compares the current cycle to past historical periods. The longest business cycles on record, including the one that followed the 2008 financial crisis and the 1990s dot-com era, lasted a decade or more.
How does the economy look today? Inflation remains elevated but could ease if oil prices stay low. The job market has picked up again, reversing last year’s concerns about slow hiring. The U.S. dollar has stabilized and rebounded recently, trade conditions are still uncertain but have steadied, and business investment has accelerated. Consumers are feeling cautious, yet continue to spend on both everyday necessities and discretionary items. Overall, the economy appears healthy despite some mixed signals, which has historically been a positive sign for financial markets over the long run.
A wide range of investments have delivered strong results this year
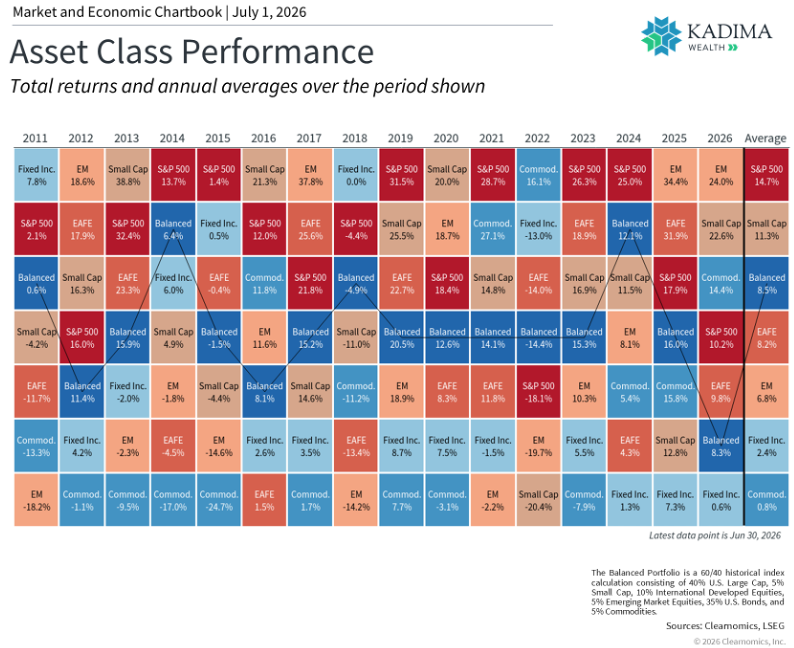
A broad mix of global investments has added value to portfolios so far this year, building on last year’s trend. This includes not just large company stocks tracked by the S&P 500, but also small company stocks, emerging market stocks, and commodities, as shown in the chart above. The second quarter, in particular, was one of the strongest on record. Part of this strength coincided with the timing of the war in Iran, which meant the market recovery got underway at the very start of April.
Several themes have driven these returns, including the strength of the economy, hopes for a peace deal in Iran, and excitement around AI. Many of these factors have supported corporate earnings growth, with profits for S&P 500 companies rising over 20% in the past twelve months.2 This strong market environment has also sparked a wave of high-profile IPOs, including SpaceX in the second quarter, along with the anticipated listings of OpenAI and Anthropic, both AI companies.
While IPOs often attract the most attention in their first few days of trading, the real benefits for investors tend to build over a much longer period. These new listings expand the range of investment options available to everyone, which is especially meaningful since many companies have been choosing to stay private for longer before going public. What matters most is how these businesses perform over the years and decades ahead. The largest technology companies today, for example, have built their value over many market and economic cycles.
All of these positive developments do mean that U.S. stock valuations are historically high. The S&P 500 currently trades at a price-to-earnings (P/E) ratio of 20x, which means investors are paying $20 for every $1 of company earnings. This is above the long-term historical average of 16x.3 These valuation measures do not tell us what markets will do over the next year or two. However, they are useful guides for building long-term portfolios, particularly when thinking about other types of investments and managing risk. Overall, this year’s results highlight the value of staying balanced across different asset types.
Inflation remains a concern, though falling oil prices offer some relief
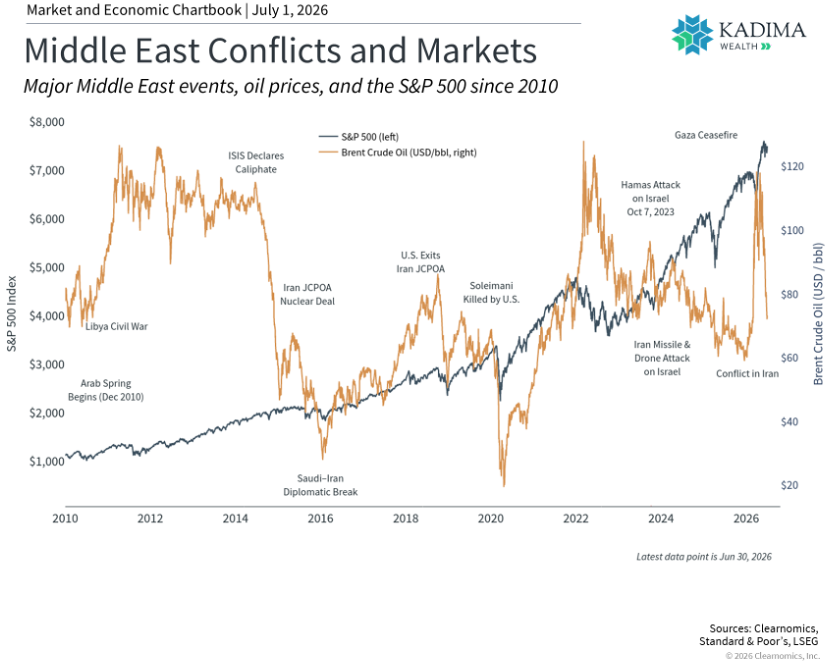
The conflict in Iran has most directly affected the U.S. economy through energy markets. Disruptions to oil shipping through the Strait of Hormuz pushed Brent crude oil prices to nearly $120 per barrel before they pulled back sharply. In recent weeks, oil prices have fallen to around $70 per barrel, close to where they were before the conflict began. Gasoline prices followed a similar path with a delay, peaking above $4.50 per gallon nationally before dropping back below $4.00 per gallon.4
These swings in energy prices have had a direct impact on overall inflation. The Consumer Price Index (CPI), which measures how much everyday goods and services cost, rose 4.2% year-over-year in May, its highest reading in several years. The gasoline component alone jumped 40.5% over that same period. Importantly, core CPI, which strips out food and energy costs to give a clearer picture of underlying inflation, rose only 2.9%.5 This suggests that higher prices have been concentrated in fuel, rather than spreading broadly across the economy.
With oil prices falling recently, many economists are hopeful that inflation may be near its peak. This pattern is similar to other past global events that disrupted oil supply, such as Russia’s invasion of Ukraine in 2022, and several other episodes shown in the chart above. Once those situations stabilized, oil prices often recovered, and inflation rates came back down over time.
Market swings have remained manageable for investors
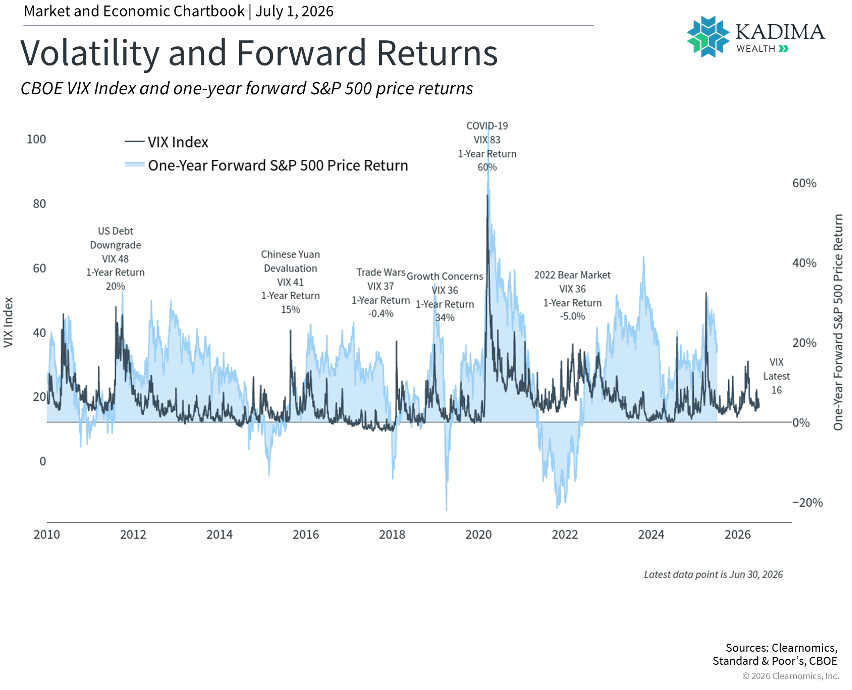
Investors have become familiar with short periods of market turbulence caused by broader economic events. Tariffs, the Middle East conflict, and uncertainty about Federal Reserve policy have all contributed to brief market swings over just the past year. This can be seen in the VIX, a well-known measure of how much volatility investors expect in the stock market. Fortunately, the current VIX reading of 16 is below its long-term average of 18.4 and well below recent peaks, as shown in the chart above. This also illustrates that periods of high volatility can sometimes present the greatest opportunities for investors.
Another helpful way to measure how market movements affect investors is to look at the largest decline each year. So far in 2026, the S&P 500’s steepest drop from peak to trough has been 9%. While declines like this are never comfortable, markets have a historical tendency to bounce back when investors least expect it. Not only has the market fully recovered from that earlier pullback, but the S&P 500 has reached 24 new all-time highs so far this year.6
The first half of 2026 shows that the biggest risk for investors during uncertain times is not the volatility itself, but how they respond to it. It is tempting to try to time the market by moving in and out of investments during turbulent periods, but this approach often backfires. An alternative approach is to hold a well-constructed portfolio designed to weather all parts of the market cycle while supporting long-term financial goals. Taking this approach helps investors prepare for the inevitable periods of uncertainty that may arise in the second half of the year.
Remaining invested matters more than sitting on the sidelines
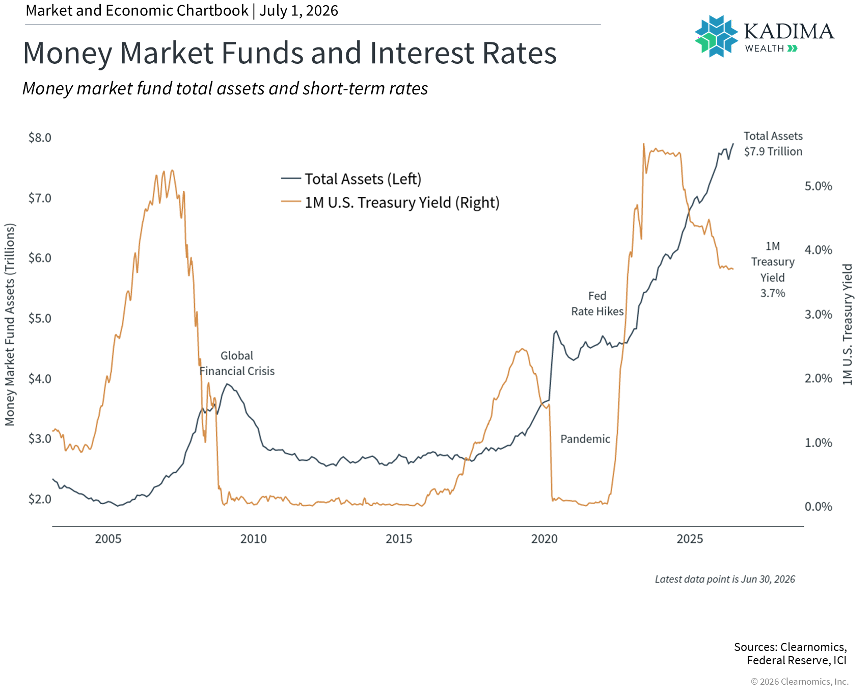
One consequence of investors moving out of the market during volatile periods is often described as “cash on the sidelines.” The main challenge with holding cash instead of investing is knowing when to get back into the market. The chart above shows just how much money is currently sitting in cash. Money market fund assets, which are low-risk funds that hold short-term investments, have reached a record $7.9 trillion. That is more than double their level before the pandemic, when interest rates were near zero. This reflects both the market uncertainty of recent years and a period of higher short-term interest rates that made holding cash more appealing.
While cash can feel safe and stable, the challenge is that what cash earns often does not keep up with inflation. For example, the current average rates on certificates of deposit mean that the real income from cash, after adjusting for inflation, is currently negative.7 Even when the stated yields on money market funds and short-term instruments look attractive, inflation and the possibility that those rates may not last can both work against the investor. Over time, this means the purchasing power of cash holdings can quietly shrink.
This is why holding a balanced portfolio that can benefit from growth, income generation, and capital preservation remains so important. As the market and economic cycle continues to evolve, this principle will only become more relevant.
The bottom line? The first half of 2026 has rewarded investors who stayed diversified and maintained a long-term perspective, even as geopolitical and economic headlines created short-term uncertainty.
References
- All figures are as of June 30, 2026 and are on a price return basis unless otherwise noted.
- Clearnomics research and LSEG data as of June 30, 2026.
- Ibid.
- https://gasprices.aaa.com/
- https://www.bls.gov/news.release/cpi.nr0.htm
- Clearnomics research and Standard & Poor’s data as of June 30, 2026.
- Clearnomics research and FDIC data as of June 30, 2026.
This material is provided for informational and educational purposes only. The information contained herein is not intended and should not be construed as individualized investment advice or a recommendation to purchase or sell any security or adopt any particular investment strategy. References to specific companies, securities, indices, asset classes, or market events are provided solely for illustrative and educational purposes and should not be construed as investment recommendations.
Historical market performance and market statistics are provided for informational purposes only and are not indicative of future results. Any opinions or forward-looking statements expressed herein are subject to change without notice. The information provided herein is believed to be reliable, but we do not guarantee its accuracy, timeliness, or completeness. It is provided “as is” without any express or implied warranties.
There is no assurance that any investment, plan, or strategy will be successful. Investing involves risk, including the potential to lose principal. Nothing herein should be interpreted as an indication of future performance.
Investment Advisory Services are offered through Mariner Platform Solutions (MPS), an SEC Registered Investment Adviser. Kadima Wealth and MPS are not affiliated entities.